Gold/Stocks ratio: Time to short Gold and Long S&P500 soonMany people will think this post is insanity, but I'm simply revisiting, and zooming on a very interesting setup I had detected some time ago.
This is a ratio chart of the S&P500 index compared to Gold. The risk off sentiment is reaching a very vivid extreme here, and like anything else, it trends with Time at Mode concepts.
I'm interested in monitoring it since we're very close to a projected target for it, and also, close to the time expiration of the last uptrend signal.
If we see a drastic turn once either (or both) targets are hit (time/price), we might be able to capture a great long term entry in this ratio.
Refer to related ideas for the monthly view.
Cheers,
Ivan Labrie.
Search in ideas for "RATIO CHART"

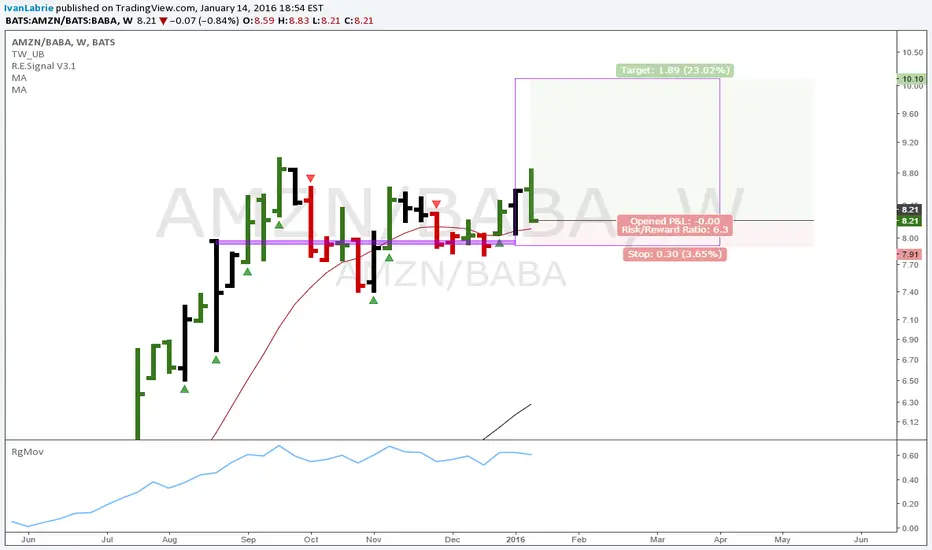
AMZN/BABA: Interesting pair tradeWe have an interesting setup with only 3.65% downside, but with a potential 23.02% upside based on my 'Time at Mode' analysis of this ratio chart.
Fundamentals for AMZN are good in the long term, it has been a relatively strong company, and has many interesting future developments ahead (like the introduction of drone delivery of goods, ocean freights from China, to name a few).
Many would consider it to be overvalued, but I think it offers a good technical and fundamental setup here, pitted against Alibaba.
The idea is to go long AMZN and short BABA, adjusting the position size based on volatility.
I won't delve much into the specifics of position sizing but it's of paramount importance for this type of trade.
If we risk 1%, we can make 6.3% in this trade, and it's an intermediate to long term trade.
Good luck if taking it with me.
Cheers,
Ivan Labrie.
(2h) The Breakout // Bullish Harmonic // IF=THEN ®FX:NZDUSD
Trade the eventual Breakout, buy the harmonic IF/When completed.
Safe Trades;
open.spotify.com


XLP is posed to underperform in 2016this a sector view
im dividing XLP to SPY and I get a ratio chart, showing if a sector is outperforming or down performing.
I think 2016 we will see onr of the leaders (XLP) becoming an underperformer.

Risk Off - are we looking at the market top?This is the ratio chart between XLP to SPY. XLP is the Consumer Staples. It looks like money is going to safer consumer stocks.

An excuse to go test the previous high // IF=THEN ®FX:USDJPY
Bearish Harmonics that can send the price to go test previous highs. (short IF and When completed)
Safe Trades;
open.spotify.com

HYG (High Yield Corporate Bonds) set to outperform TLTUS Corporate Bonds (8-10Yrs) Vs US Treasury Bonds (20Yrs)
Rising Ratio = Corporates Outperforming Treasuries
BLUE BARS = THE S&P500 STOCK MARKET INDEX
When Corporates underperform Treasuries and the ratio declines on this chart (black bars), USUALLY the stock market has gone down at the same time (NOTE THE BLUE BARS at the same time as the RED HIGHLIGHTED AREAS on the ratio chart). Treasuries in the last year have rocketed higher and is very likely from Central Banks both here in the US and around the world buying up US Treasuries (and the US Dollar).
HYG looks poised to outperform TLT to the tune of 10%-30% over the next year.
(Note: the MACD is a measure of the 12 and 26 week moving average. When the 12-week average is above the 26-week average, the "trend" can be considered "UP" and vice-versa. You can see the long trend down in the MACD that has now turned back UP, possibly signifying a change in "trend" from down to up.)
Tim
April 2, 2015 11:23AM EST 68.97 Ratio of (HYG*100/TLT). HYG is 90.48 +0.09, TLT is 131.21 -0.92 today

AUDUSD: BULLISH SWINGOUR LAST UPDATES SETUP
SETUP PLAN TRADE
We appreciate your interest in our analysis, if you agree (or not) with our work, and would like to continue reading our opinions, be part of it with your "I Like"... Thanks you!
SignalSuisse
www.nonsolotrading.com


AUDUSD: SUPPORT AREASETUP PLAN:
We appreciate your interest in our analysis, if you agree (or not) with our work, and would like to continue reading our opinions, be part of it with your "I Like"... Thanks you!
SignalSuisse
www.nonsolotrading.com

AUDUSD: Continuation our SetupSETUP PLAN: (PUT STOP BELOW 0.7080 DAILY CLOSE)
We appreciate your interest in our analysis, if you agree (or not) with our work, and would like to continue reading our opinions, be part of it with your "I Like"... Thanks you!
SignalSuisse
www.nonsolotrading.com

Short the 618 and buy the bulls // IF=THEN ®FX:AUDJPY
Sell the 61.8% retracement, Buy Bullish patterns when completed; IF=THEN ®
First things first:
The Big Cypher
Point B:
38.2% to 61.8% XA
Point C:
127% to 141% ext XA
Point D: (Enter Long)
78.6% XC
Target:
TP1 38.2% CD
TP2 61.8% CD
Next:
The Double Top (eventual 2618 setup) - how to trade a double top - link below *
1. Broken neck
2. The price found supportMN1 and start to recover but has been rejected close to previous support now resistance (grey line)
3. IF we get the 61.8% retracement the 2618 setup is completed and we will be in a good risk/reward situation to enter short (check price action);
4. AB=CD basic pattern as first target ( synced with the 61.8% retracement from all bulls move from X to C points );
4. Second target, close to the 161% extension, also synced or close to point D for Major Cypher Pattern around the 65$ , it can be extend around the 227% around the 60$.
IN THE MIDDLE:
EVENTUAL SMALL BAT IF the price break the supMN1*
Point B:
38.2% to 50% XA
Point C:
38.2% to 88.6% AB
Point D:
88.6% XA
Targets:
TP1 38.2% AD
TP2 61.8% AD
Ratios:
Double Top:
Safe trades;
open.spotify.com

Bulls are tired, or not yet? IF=THEN ®FX:EURUSD
This is a Cypher not yet invalidated despite the oscillation and volatility.
We are trading below the resistance and a retracement is expectd, lower time frames advanced patterns completed at this level, there's short positions standing by...
At major time frame there's an eventual cypher being forged, targeting the 38% retracement from weekly chart, also synced with an obvious AB=CD pattern target and finally synced with previous structure low's from 24 July 2012.
Ratios:
CYPHER:
Point B:
38.2% to 61.8% XA
Point C:
127% to 141% ext XA
Point D:
78.6% XC
Target:
TP1 38.2% CD
TP2 61.8% CD
Safe Trades;

EURAUD: Ideal opportunity for a pair tradeAfter seeing The Working Trader's idea I figured I could attemp a pair trade in this pair, to take advantage of the interest rate differential in both EURUSD short and AUDUSD long.
The entry will be a market order, but I'd have to see how the markets open tomorrow, I will update the chart by then.
For now, keep in mind that for pair trades, I aim to open a big position on each side, which thanks to the pair trade's more 'market neutral' stance, lets me use no stop loss and be somewhat safe, at least, as long as the ratio chart's setup is valid (in this case EURAUD).
The advantages are multiple, check out The Working Trader's post in 'related ideas' for more information, I detailed it there.
For now, if you want to enter this trade, find out the ADR value (atr of 1,5,10 and 20 bars added together and divided by 4). Once you know this you can calculate position size in base on your desired risk, per day.
You will have to watch the trade, unless you're deep in profit, it won't be a set and forget deal.
Good luck, and wait for the update regarding entry tomorrow.
Target is initially the time at mode one, but it can retrace the whole terminal wedge (it should for it to be valid, and it has to occur in 1/3-1/4 the time it took to be formed).
Cheers,
Ivan.

The crippled Cypher // Double Bottom - 2618 setup // IF=THEN ®FX:GBPUSD
Double bottom above support, IF the price break the previous structure or pressure zone, and find resistance above, it can eventually pull back to the 61.8% giving us an eventual 2618 setup to trade with a target around the 161% extension.
Also a crippled Cypher pattern which exceeded point B slightly above the 61.8%, in fact, touches the 76% retracement, creating a mistrust of state.
Ratios:
Double's ;) :
Safe trades;

The 161 Street // Eventual H&S // Harmonics // IF=THEN ®FX:USDJPY
A lot of things can happen...
My first reaction, Long the 161.8% ext... almost synced with the cypher...
Check ratios:
Safe trades;

Bearish Bat pattern // Double Bottom // Eventual 2618// IF=THEN®FX:NZDUSD
A very quick view on this pair to follow.
Eventual Bat pattern;
Eventual 2618;
Short @D
BAT :
Point B:
38.2% to 50% XA
Point C:
38.2% to 88.6% AB (must close above point A to still valid)
Point D:
88.6% XA
Targets:
TP1 38.2% AD
TP2 61.8% AD
Safe trades;

GcNaif Gartley & Trading_Jazz Cypher // Completed ®FX:XAUUSD
Thanks to @GcNaif, we shared these views on chat, and i decided to publish them.
www.tradingview.com
Safe trades;
Ratios:

Bullish Gartley // Long @ D // IF=THEN ®FX:USDCAD
CYPHER :
Point B:
38.2% to 61.8% XA
Point C:
127% to 141% ext XA
Point D:
78.6% XC
Target:
TP1 38.2% CD
TP2 61.8% CD
Ratios:
Safe Trades;

USD/JPEG next time i will print as *pdf ;) // IF=THEN ®FX:USDJPY
Short the Gartley
Point B:
61.8% can not touch 78.6% XA
Point C:
38.2% to 88.6% AB
Point D:
78.6% XA
127% ext AB
Target:
TP1 38.2% AD
TP2 61.8% AD
Long the Bat
Point B:
38.2% to 50% XA
Point C:
38.2% to 88.6% AB
Point D:
88.6% XA
Targets:
TP1 38.2% AD
TP2 61.8% AD
Ratios:
Safe Trades;

The Gartley programming a Cypher // IF=THEN ®FX:USOIL
We are going through moments of bears pressure, expecting to see the price to go test Daily Support D1 or Monthly Support MN1 below, keeping both patterns valid and forging one eventual Buy opportunity ;
IF the price exceeds the 61.8% (supportMN1) it will invalidate the Cypher... (check ratios below)
Short the Gartley @D;
Long the Cypher @D;
Bearish Gartley:
Point B:
61.8% can not touch 78.6% XA
Point C:
38.2% to 88.6% AB
Point D:
78.6% XA
127% ext AB
Targets:
TP1 38.2% AD
TP2 61.8% AD
Bullish Cypher:
Point B:
38.2% to 61.8% XA
Point C:
127% to 141% ext XA
Point D:
78.6% XC
Targets:
TP1 38.2% CD
TP2 61.8% CD
Safe TradesM
open.spotify.com

The Butterfly with an empty soul // Completed?FX:USDCAD
As previously published, the price reached "the expected area", Butterfly "almost" ready to engage, however, I think there is something missing , AB=CD pattern ends slightly above, the 61.8% retracement also very close, price action printing higher lows and lower highs , looks like, or, probably one bullish pennant is being forged here...
*Keep an eye on this flyer...
Previous published idea:
BEARISH BUTTERFLY
Point B:
78.6% XA
Point C:
38.2% AB
88.6% AB
Point D
161% ext BC
261% ext BC
Targets:
TP1 61.8% CD
TP2 127% CD
Ratios:
Safe Trades;
open.spotify.com
